
As education – and really the world as a whole – is becoming more and more open-sourced, it makes perfect sense that geography would follow suit. Well, sort of. MapStory is one of the more interesting things that we were able to see at the 2014 Florida Educational Technology Conference (FETC). According to the creators:
MapStory is a place to unify and improve our shared knowledge about global change. We envision a world where everyone’s wisdom can be tapped, peer reviewed and organized into a non-commercial global data commons that helps us all improve our understanding of global dynamics, worldwide, over the course of history.
Although that description is a bit convoluted, and doesn’t really describe the use of MapStory, once you know and understand what MapStory is, it is a perfect way to capture the essence of the software.
A MapStory is a new way of communicating important issues to a global audience, communicating to others how the world has changed over time — how the world has transformed — communities, cities, nations, migrations, trade, cultures and languages, ideas, diseases, wars, the natural environment, the shifting of continents, events and eras, and any kind of statistic – as they are arrayed across local, regional or global landscapes.1
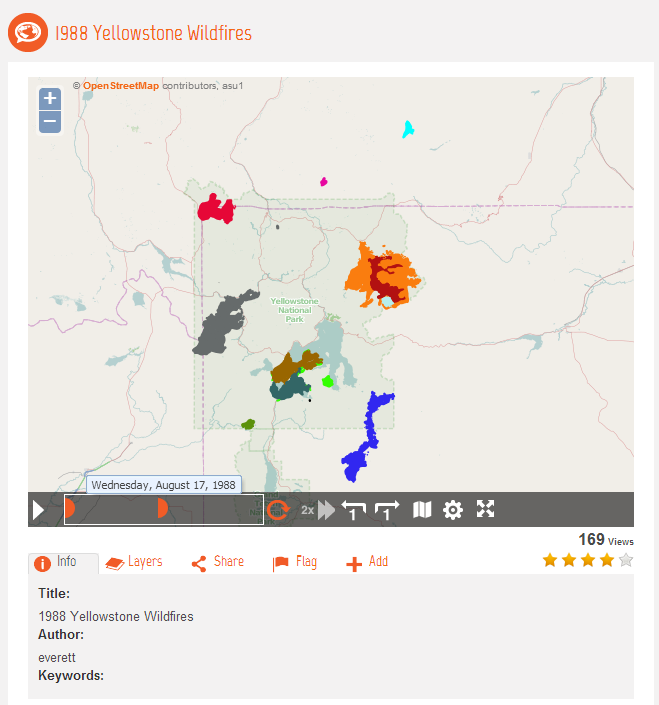 To boil the essence of the software down, a MapStory is an open-source platform for creating mapped displays of data sets. Think of a MapStory as a sort of video, showing trends, movements, events, or locations (among many others) on a map, over time. The MapStory pictured to the left, for example, shows how the 1988 Yellowstone shifted and grew over the course of several months. MapStory has the potential to become a sort of Wikipedia for visual data.
We had a chance to speak with Jonathan Marino, the Director of Content and Strategy for MapStory, at FETC:
Check out all of our coverage of the 2014 Florida Educational Technology Conference (FETC).