


On 12 February 2014, the International Data Corporation (IDC) released some data from their Worldwide Quarterly Mobile Phone Tracker.1 There is some really interesting data in the report for the smartphone market as a whole, as well as some telling data on the various mobile operating systems.

Via IDC
In 2013, smartphone manufacturers as a whole passed a monumental threshold for the first time. Last year smartphone “vendors shipped a total of 1,004.2 million smartphones worldwide, up 38.4% from the 725.3 million units in 2012.”2 The industry has doubled in size in just about two years. According to Ramon Llamas, Research Manager with IDC’s Mobile Phone team, “Total smartphone shipments reached 494.4 million units worldwide in 2011, and doubling that volume in just two years demonstrates strong end-user demand and vendor strategies to highlight smartphones.”3
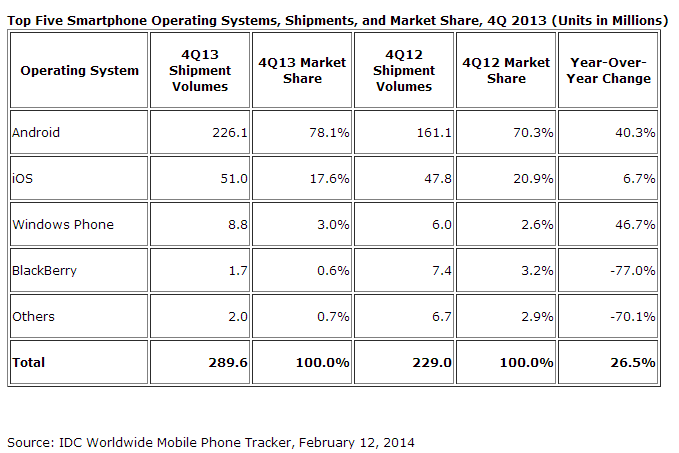
Via IDC
The statistics and data on the various mobile operating systems, however, paint an entirely different picture. The top two smartphone vendors – Samsung and Apple – accounted for more than 46% of total smartphone shipments in 2013. On the other hand, the top two mobile operating systems – Android and iOS – accounted for a whopping 93.8% of all smartphone shipments in 2013, with Android holding a clear advantage with a total market share of 78.6%. It appears that while Android and iOS are growing – in terms of both market share and total shipments – BlackBerry and Windows mobile OS are evaporating and stagnant, respectively. From 2012 to 2013 BlackBerry’s market share had a -40.9% change. The company had better act fast before their market share completely disappears.