
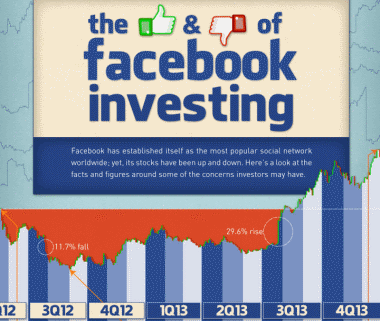
We just came across this interesting infographic from Finance Degree Center. The infographic takes a very detailed look at the volatility of Facebook stock, and some of the factors behind said volatility. Think about it, FB stock has been as low as $17.73 a share, and as high as $57.96 a share. Further, at the time of Facebook’s IPO, the company was valued in excess – perhaps overvalued – $104 billion.
For all the volatility, Facebook is more profitable than ever, in Q3 2013 alone, the company saw revenues of $2.02 billion, an increase of 60% year-over-year. Daily active users are also skyrocketing, totaling around 728 million on average for September 2013, an increase of 25% year-over-year.
Anyhow, there is some very interesting data below:
